
Lord Abbett
Reporting UI
About The Client
Since its founding in 1929, Lord Abbett has maintained a singular focus on the management of money. As an investment-led, investor-focused firm, Lord Abbett evaluates every decision from an investment perspective, in an effort to achieve a superior, long-term investment performance on behalf of its clients. Currently, Lord Abbett has more than $140 billion in assets under management.
Work Carried Out
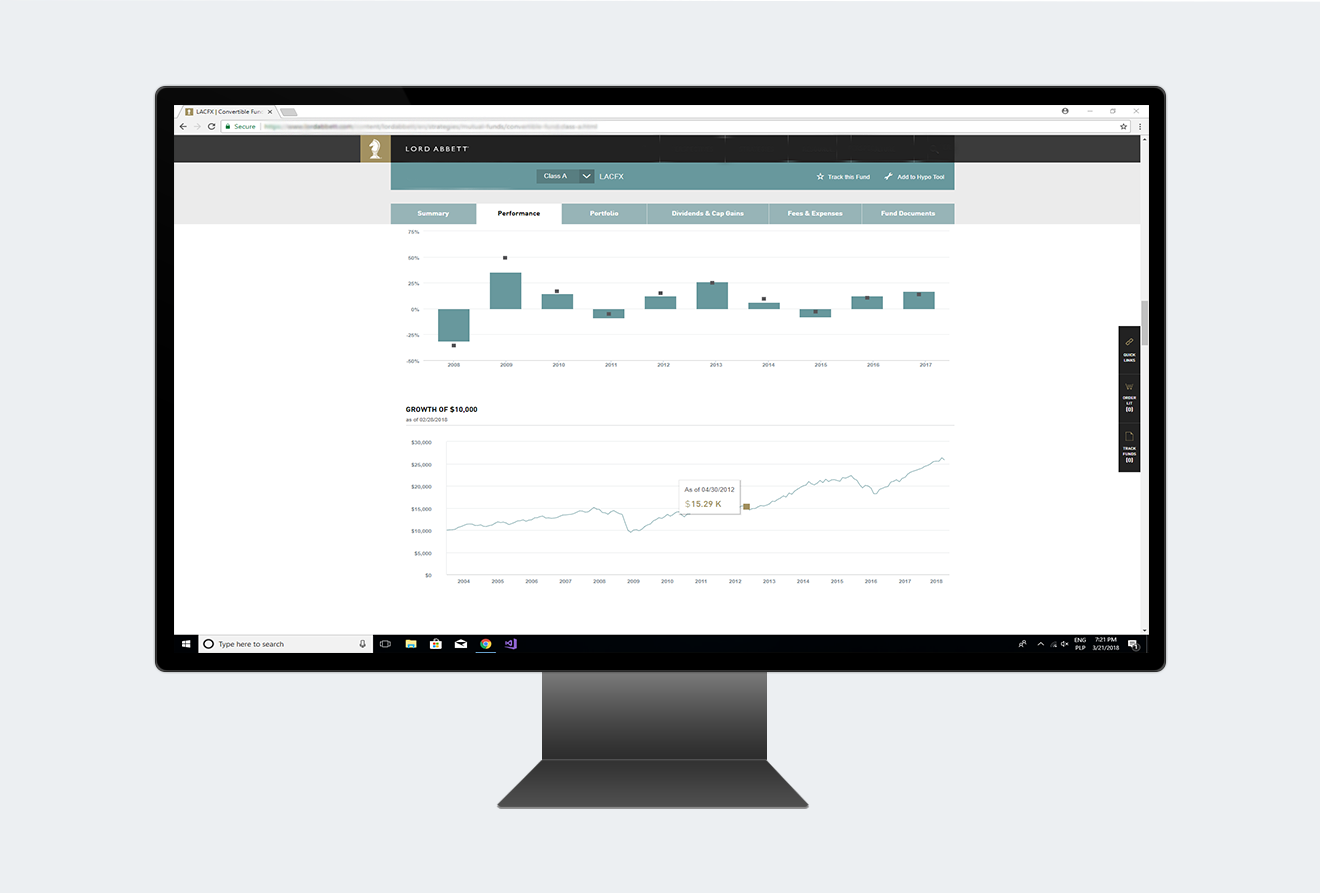
A user interface for various Lord Abbett teams, to preview generated reports for a given “As Of Date”, download Excel reports, run time series comparisons for both calculated values and used metadata. With a granular permissions system, only the administrators can review and influence the metadata driving the process of reports generation. The intuitive design allows the administrators to perform CRUD operations on the database without knowing SQL syntax. Also, it allows business analysts to validate convertibles, and upload the analytics files in real-time.
Challenge
In the first phase of this project, our team was asked to design and implement the initial version of the reporting UI, which later was distributed to the selected users. This MVP was limited to displaying the current pre-processed metadata configuration, and previewing reports generated in the given month. With successful reviews, the management decided to extend the MVP with a number of new features. One of those features was a tool to compare values of a selected report over a period of time. This request was especially difficult, because at a certain point of time, there was a major backend update that included a change to the metadata and report structures. To serve users with all historical data, we wrote two connection layers, which were concurrently retrieving data and a set of transformers, which were able to unify retrieved data.
Applied Technologies

Hibernate

Spring

Angular

Azure SQL Server

JavaScript

Java
Project diagram
Data
Providers
Providers


Data


Let’s discuss your project
Contact Us

